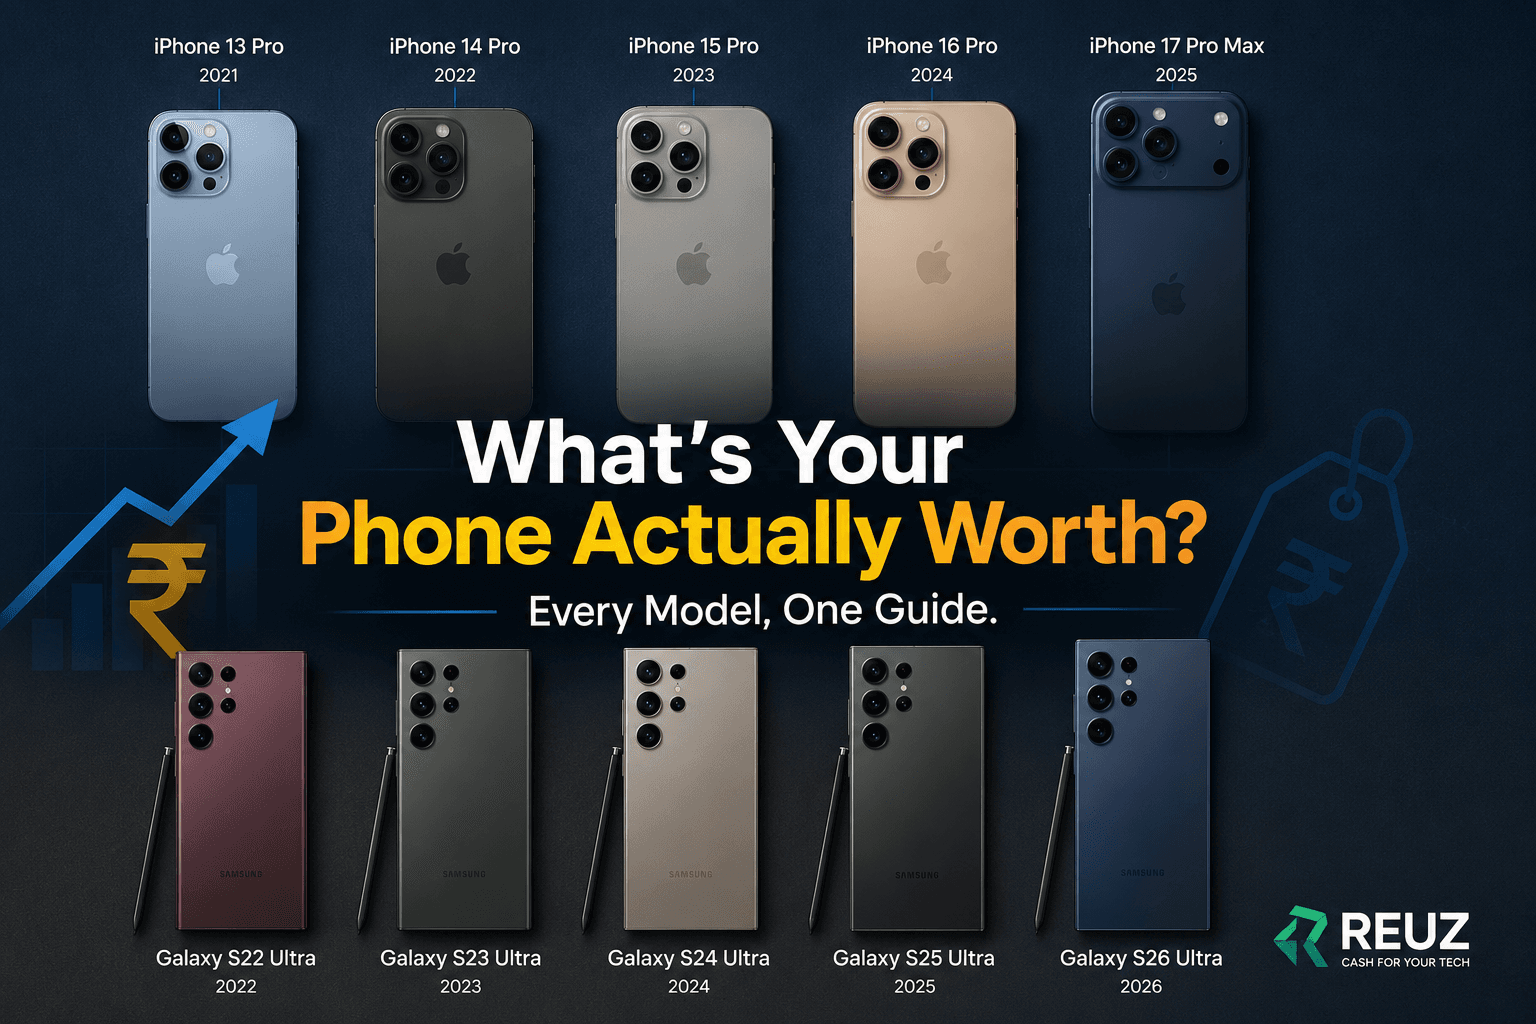
iPhone & Samsung Galaxy Resale Value Guide: Every Model's Worth in India (2026)
By Reuz Editorial Team | 13–15 min read | June 2026 | Resale Value / Price Guides
QUICK ANSWER: As of June 2026, an iPhone Pro or Pro Max typically retains 68–78% of its value after two years and 48–58% after three — the strongest resale performance of any smartphone category sold in India. Samsung Galaxy S Ultra models retain roughly 48–55% after two years, with the gap narrowing each generation thanks to Samsung's 7-year update commitment. This guide gives you exact estimated resale values for every major iPhone Pro/Pro Max, Galaxy S Ultra, Galaxy Z Fold/Flip, OnePlus flagship, and Pixel Pro model released since 2021 — find your model below.
Every Premium Phone Loses Value Differently — Here's the Full Picture
If you've ever searched 'how much is my iPhone worth' or 'Samsung Galaxy resale value India' and landed on a page with vague ranges and no specific model data, this guide is built to fix that. Below you'll find estimated resale values for every major premium phone released in India since 2021 — organised by brand, generation, and model, with launch price, current value, and percentage retained.
This isn't a generic depreciation explainer. It's a reference guide you can actually use: find your exact phone, see roughly what it's worth today, and understand how that compares to other models and generations.
HOW TO USE THIS GUIDE: Find your phone's brand and model in the tables below for an estimated current value range. These are directional estimates for Good–Like New condition with battery health above 80% and original accessories. For a precise quote reflecting your phone's exact condition, storage, and current demand, use the instant quote tool at reuz.in.
iPhone Pro & Pro Max Resale Value by Model (2021–2025)
iPhone Pro and Pro Max models consistently deliver India's strongest resale performance of any smartphone category. Here's what each generation is worth as of June 2026.
|
Model |
Launch Year |
Launch Price (256GB) |
Est. Value (Jun 2026) |
Value Retained |
|
iPhone 17 Pro Max |
2025 |
~₹1,54,900 |
~₹1,20,000–₹1,35,000 |
~78–87% |
|
iPhone 17 Pro |
2025 |
~₹1,34,900 |
~₹1,05,000–₹1,18,000 |
~78–87% |
|
iPhone 16 Pro Max |
2024 |
~₹1,44,900 |
~₹1,05,000–₹1,18,000 |
~72–81% |
|
iPhone 16 Pro |
2024 |
~₹1,29,900* |
~₹90,000–₹1,02,000 |
~69–79% |
|
iPhone 15 Pro Max |
2023 |
~₹1,59,900 |
~₹82,000–₹95,000 |
~51–59% |
|
iPhone 15 Pro |
2023 |
~₹1,34,900* |
~₹68,000–₹78,000 |
~50–58% |
|
iPhone 14 Pro Max |
2022 |
~₹1,39,900 |
~₹55,000–₹65,000 |
~39–46% |
|
iPhone 14 Pro |
2022 |
~₹1,29,900 |
~₹46,000–₹54,000 |
~35–42% |
|
iPhone 13 Pro Max |
2021 |
~₹1,29,900 |
~₹40,000–₹48,000 |
~31–37% |
|
iPhone 13 Pro |
2021 |
~₹1,19,900 |
~₹34,000–₹41,000 |
~28–34% |
*256GB launch price for these generations was estimated based on the confirmed base storage price plus the standard 256GB step-up, as official 256GB-specific launch pricing for some variants was not separately published. Values reflect Good–Like New condition, battery health above 80%, June 2026 Indian secondary market data.
What the iPhone Data Shows
Two patterns stand out immediately. First, Pro Max models consistently retain slightly more value than their Pro counterparts in the same generation — the larger screen and longer battery life keep demand higher even as the phone ages. Second, the retention curve is remarkably consistent: expect roughly 8–12 percentage points of value loss for every additional year of age, a pattern that has held steady across five generations.
The iPhone 16 Pro Max and iPhone 17 Pro Max currently sit in the strongest position of any model in this guide — both retain over 75% of launch value within their first 12–18 months, reflecting continued strong demand and Apple's constrained new-device supply in India.
Samsung Galaxy S Ultra, Z Fold & Z Flip Resale Value by Model (2022–2026)
Samsung's flagship tier — Galaxy S Ultra and the Z Fold/Flip foldable line — represents Android's strongest resale performers in India, though the retention curve differs meaningfully from iPhone.
|
Model |
Launch Year |
Launch Price (256GB) |
Est. Value (Jun 2026) |
Value Retained |
|
Galaxy S26 Ultra |
2026 |
~₹1,39,999 |
~₹1,08,000–₹1,18,000 |
~77–84% |
|
Galaxy S25 Ultra |
2025 |
~₹1,29,999 |
~₹88,000–₹98,000 |
~68–75% |
|
Galaxy S24 Ultra |
2024 |
~₹1,29,999 |
~₹62,000–₹72,000 |
~48–55% |
|
Galaxy S23 Ultra |
2023 |
~₹1,24,999 |
~₹52,000–₹62,000 |
~42–50% |
|
Galaxy S22 Ultra |
2022 |
~₹1,09,999 |
~₹33,000–₹41,000 |
~30–37% |
|
Galaxy Z Fold 6 |
2024 |
~₹1,64,999 |
~₹85,000–₹1,00,000 |
~52–61% |
|
Galaxy Z Fold 5 |
2023 |
~₹1,54,999 |
~₹58,000–₹70,000 |
~37–45% |
|
Galaxy Z Flip 6 |
2024 |
~₹1,09,999 |
~₹48,000–₹58,000 |
~44–53% |
|
Galaxy Z Flip 5 |
2023 |
~₹99,999 |
~₹32,000–₹40,000 |
~32–40% |
Values reflect Good–Like New condition, battery health above 80%, original accessories where applicable, June 2026 Indian secondary market data.
What the Samsung Data Shows
The Galaxy S Ultra line shows a clear generational improvement in value retention. The Galaxy S22 Ultra (2022) retains roughly 30–37% after four years, while the newer Galaxy S25 Ultra is on pace to retain 68–75% after just one year — a substantially stronger curve. This lines up with Samsung's shift to a 7-year software update commitment starting with the Galaxy S24 generation, which has measurably increased buyer confidence in long-term usability.
Foldables tell a more complex story. Both Z Fold and Z Flip models depreciate faster than the S Ultra line in their first generation or two, reflecting buyer caution around hinge durability and rapid category-wide hardware improvement. However, the gap is narrowing with each release as foldable technology matures and buyer trust increases.
KEY INSIGHT: The resale gap between iPhone and Samsung Galaxy S Ultra has narrowed significantly over the past three generations. A Galaxy S22 Ultra buyer in 2022 saw meaningfully faster depreciation than an iPhone 13 Pro Max buyer from the same year. But a Galaxy S25 Ultra buyer today is on a retention curve that's much closer to the equivalent iPhone 16 Pro Max — within roughly 10 percentage points at the same age, down from a 20+ point gap three generations ago.
OnePlus & Google Pixel Pro Resale Value by Model
OnePlus's numbered flagship series and Google's Pixel Pro line round out India's premium phone resale market, each with a distinct value curve shaped by brand-specific factors.
|
Model |
Brand |
Launch Price (Approx.) |
Est. Value (Jun 2026) |
Value Retained |
|
OnePlus 13 |
OnePlus |
~₹69,999 (256GB) |
~₹38,000–₹44,000 |
~54–63% |
|
OnePlus 12 |
OnePlus |
~₹64,999 (256GB) |
~₹26,000–₹33,000 |
~40–51% |
|
OnePlus 11 |
OnePlus |
~₹56,999 (128GB) |
~₹17,000–₹22,000 |
~30–39% |
|
Pixel 9 Pro |
Google |
~₹1,09,999 (128GB) |
~₹62,000–₹72,000 |
~56–65% |
|
Pixel 8 Pro |
Google |
~₹1,06,999 (128GB) |
~₹42,000–₹50,000 |
~39–47% |
|
Pixel 7 Pro |
Google |
~₹84,999 (128GB) |
~₹26,000–₹33,000 |
~31–39% |
Values reflect Good–Like New condition, battery health above 80%, June 2026 Indian secondary market data.
Why OnePlus and Pixel Depreciate Faster Than iPhone or Samsung
OnePlus flagships hold a loyal enthusiast following in India, which sustains reasonable demand, but the brand's frequent aggressive pricing on new models — sales, bundled offers, and trade-in promotions — puts consistent downward pressure on used prices. A new OnePlus model on sale can sometimes cost close to a used previous-generation unit, which compresses resale value for the older phone.
Google Pixel Pro models carry strong appeal among photography enthusiasts and benefit from long-term Android update guarantees, but India's more limited Pixel retail and service centre presence compared to Apple or Samsung creates some buyer hesitation in the secondary market, which is reflected in a faster depreciation curve despite the phone's genuine hardware quality.
Two-Year and Three-Year Retention: The Full Comparison
Here's the consolidated view — how each premium phone category performs at the two most common resale decision points: two years and three years of ownership.
|
Brand / Line |
Avg. Retention After 2 Years |
Avg. Retention After 3 Years |
Why |
|
iPhone Pro / Pro Max |
~68–78% |
~48–58% |
Constrained India supply, 5–6 yr iOS support, strong aspirational demand |
|
Samsung Galaxy S Ultra |
~48–55% |
~35–42% |
Improving fast — 7-yr update commitment narrowing the gap with iPhone |
|
Samsung Galaxy Z Fold/Flip |
~44–53% |
~32–40% |
Newer category; rapid year-on-year hardware improvement compresses older-gen value |
|
OnePlus (numbered flagship) |
~40–51% |
~28–36% |
Loyal enthusiast base, but frequent aggressive new-model pricing pressures used values |
|
Google Pixel Pro |
~39–47% |
~28–35% |
Strong camera reputation offset by limited India retail/service presence |
If resale value is a genuine factor in your next phone purchase, this table tells the clearest story: iPhone Pro/Pro Max remains the strongest performer by a meaningful margin, Samsung Galaxy S Ultra is the strongest Android option and closing the gap generation over generation, and foldables, OnePlus, and Pixel Pro all offer solid but comparatively faster-depreciating alternatives.
What Actually Drives These Differences
The resale value gaps in the tables above aren't random — they trace back to a consistent set of underlying factors.
● Software support window: Apple provides 5–6 years of iOS updates; Samsung now matches this with 7 years on flagship models since the Galaxy S24 generation. Both far exceed most other Android brands, which explains why iPhone and Samsung Galaxy S/Z consistently outperform OnePlus and Pixel.
● Constrained India supply: Import duties on iPhone Pro models limit new-device availability relative to demand, sustaining strong used-market pricing. Samsung's Ultra tier benefits from a similar, though less pronounced, effect.
● Brand trust in the resale market: Buyers pay a premium for devices from brands with strong local service centre networks and spare parts availability — a factor that favours Apple and Samsung over Google specifically in the Indian market.
● Pace of category innovation: Foldables depreciate faster than traditional flagships in their early generations because year-on-year hardware improvements (hinge durability, crease reduction, weight) are more dramatic, making older units feel outdated faster.
● New-model pricing aggression: Brands that discount new models heavily or run frequent flagship sales — as OnePlus often does — inadvertently suppress resale prices on the previous generation.
How to Use This Guide to Time Your Sale
Beyond simply checking your model's current value, this data is useful for making a smarter timing decision.
If Your Phone Is in Its First 12–18 Months
You're likely near peak resale value. For iPhone Pro/Pro Max and Galaxy S Ultra models specifically, this is the strongest window — value has only started its gradual decline, and you'll capture the most cash by selling before the next generation's announcement.
If Your Phone Is 2–3 Years Old
You're past the steepest depreciation curve but still holding meaningful value — particularly for iPhone Pro/Pro Max models, which retain 48–58% even at the three-year mark. This is a reasonable window to sell if you're considering an upgrade, since further waiting yields diminishing returns relative to the convenience of selling now.
If Your Phone Is 4+ Years Old
Value has typically stabilised at a lower plateau. There's less urgency tied to a specific launch calendar at this stage, but the phone also isn't gaining value by sitting unused — if you're not actively using it, selling now captures whatever value remains rather than letting it continue eroding.
Find out exactly what your phone is worth today. Get your precise, condition-based quote at reuz.in — instant estimate, free doorstep pickup, same-day payment.
About This Data
The estimates in this guide are compiled from Reuz's own transaction data, cross-referenced against published Indian launch pricing and aggregated secondary market data as of June 2026. They represent directional ranges for devices in Good to Like-New condition — actual value depends on your phone's specific condition, storage variant, battery health, original accessories, and current local demand.
E-E-A-T NOTE: This guide is updated periodically to reflect current market conditions. For the most accurate, personalised value for your specific device, the instant quote tool at reuz.in reflects live pricing data rather than the generational averages shown here.
Now you know what your phone's generation is worth. Find out what yours is worth exactly. Check your precise quote at reuz.in in 60 seconds — free doorstep pickup, transparent inspection, same-day payment.